Debugging a Memory Leak in Silverlight 4
The Problem
I was having a bit of trouble with a memory leak somewhere in my Silverlight 4 application. There was nothing obvious in my code that was causing it, I was cleaning up and disposing of objects as I went. I then discovered the very handy WinDbg tool that comes as part of the Debugging tools for Windows download. Using this it becomes a lot easier to find, and fix, your memory leak.
The Solution
First you need to download and install the Debugging tools for Windows, after this is done go through the following procedure to find and fix the memory leak.
- Run your application in IE and get it to a stage where you think the memory leak is occuring. If you are running the application from Visual Studio you need to start without debugging (Ctrl+F5), or WinDbg won’t be able to attach because the VS debugger is already attached.
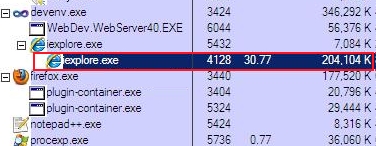
- Next you need to find the Process ID (PID) of the IE process running the Silverlight application. Since multiple IE instances will be running I’ve found the easiest way to do this is to use the Process Explorer tool. The PID you want is the child process, not the parent. See screenshot below with PID 4128 highlighted:
- Now that you have the appropriate PID, open up WinDbg and select File -> Attach to a Process (or press F6). This will show you a list of all processes, select the appropriate process and hit the OK button.
- Before you can see any stats for the Silverlight app you need to load the sos.dll for Silverlight, to do this use the command
.load C:\\Program Files\\Microsoft Silverlight\\4.0.50917\\sos.dll(changing file path as appropriate). This now enables you to view all debug information for the application. - There are a few different commands that you can use from here to assist you in hunting down the memory leak:
!dumpheap -statshows a listing of all objects that are in memory, how many instances there are of each and the total space that they take up. From here you can easily see if there is a particular object that is not being cleared.
!dumpheap –stat –type TYPENAMEwill show the same above status but for the specified type.!dumpheap –type TYPENAMEwill show a listing of all memory addresses for the specified type. You can then use the memory address with the “!gcroot ADDRESS” command. This shows what is holding the reference to the object, helping you hunt down what is holding a reference and preventing the object being cleared.
In my case the memory leak issue was actually caused by an issue with the ContextMenu from the Silverlight Toolkit not unsubscribing from the MouseMove event and so not being garbage collected.